January 15, 2026
Late last week, mortgage rates dropped, driving the weekly average down to its lowest level in more than three years. The impacts are noticeable, as weekly purchase applications and refinance activity have jumped, underscoring the benefits for both buyers and current owners. It appears that housing activity is improving and poised for a solid spring sales season.
- The 30-year fixed-rate mortgage averaged 6.06% as of January 15, 2026, down from last week when it averaged 6.16%. A year ago at this time, the 30-year FRM averaged 7.04%.
- The 15-year fixed-rate mortgage averaged 5.38%, down from last week when it averaged 5.46%. A year ago at this time, the 15-year FRM averaged 6.27%.
Information provided by Freddie Mac.

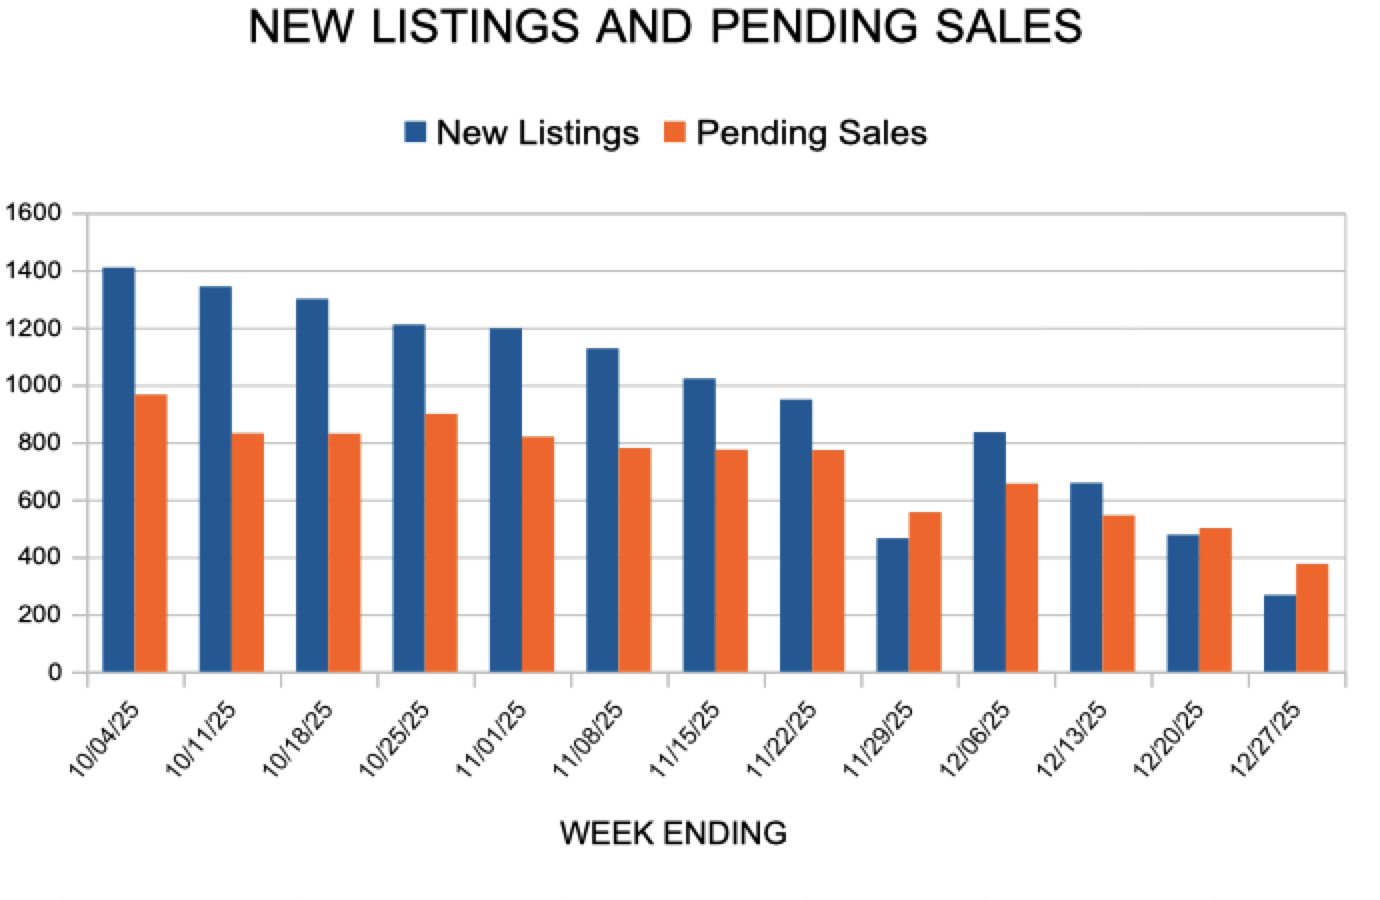
 For Week Ending January 3, 2026
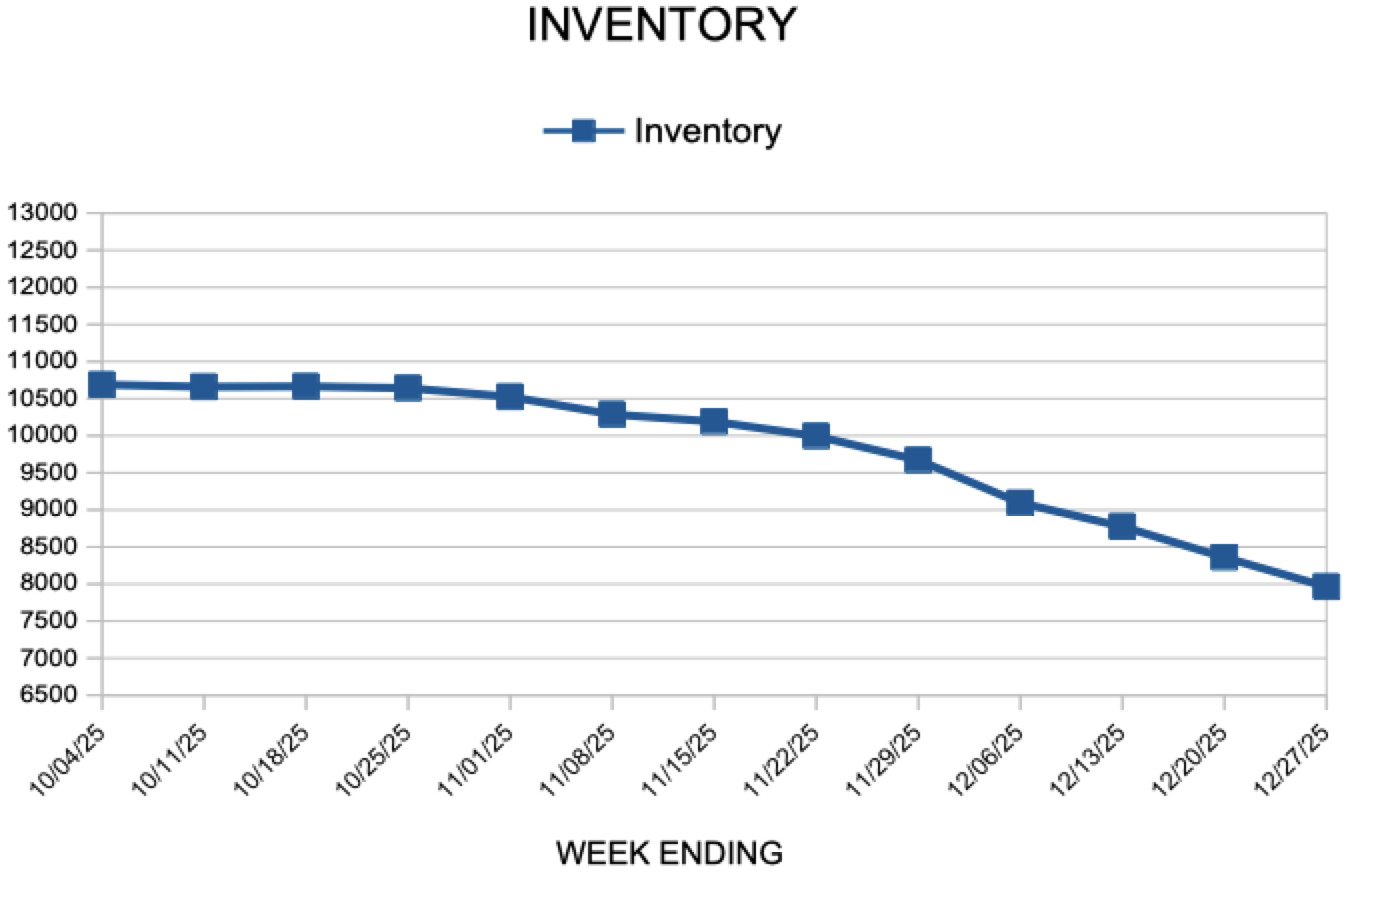