New Listings and Pending Sales
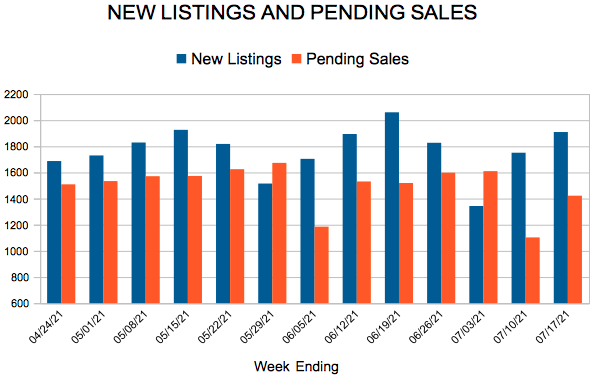
 For Week Ending July 17, 2021
Cash buyers continue to make up a significant portion of the U.S. housing market, with nearly one-third of home sales this year being all-cash purchases. Although investors make up a considerable number of cash sales transactions, the increasing availability of remote work during the pandemic has allowed some homeowners to sell their homes in pricey markets and relocate to less-expensive locales, where they’re able to pay cash for a new home, giving them an edge in a highly competitive market.
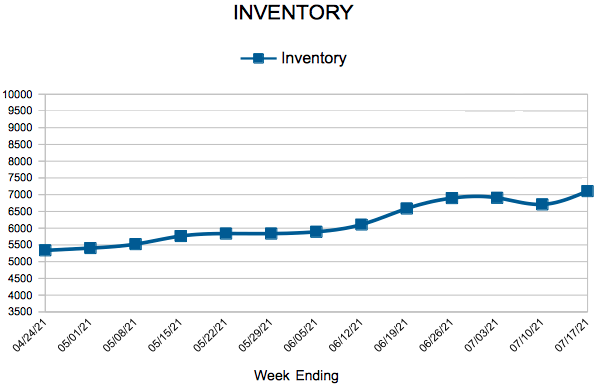
In the Twin Cities region, for the week ending July 17:
For the month of June:
All comparisons are to 2020
Click here for the full Weekly Market Activity Report. From MAAR Market Data News.
The increase in sales prices comes with a slight decline in existing home sales nationwide, as homebuyers struggle with declining affordability amid a lack of inventory, forcing some buyers to simply wait it out in hopes of more inventory and less competition.
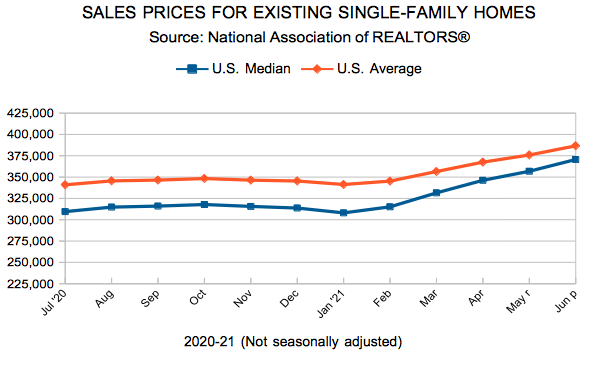
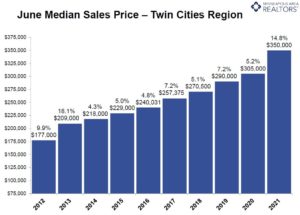
(July 16, 2021) – According to new data from the Minneapolis Area REALTORS® and the Saint Paul Area Association of REALTORS®, the median sales price for a home grew 14.8 percent to $350,000 in the Twin Cities metro area over the month of June. This milestone figure is the result of consistent year-over-year growth in median sales price. This year, all six months have experienced a 10.0 percent increase or greater in median sales price, amounting to a nominal increase of $49,000.
Buyer activity in June fell slightly, down 2.5 percent from 2020, after twelve straight months of strong upward momentum. Although this past month was inconsistent with the year-long positive trend, 2021 surpassed the benchmark set in 2019 by 10.9 percent when considering year-to-date performance. Additionally, median days on market for listings remained at a rapid seven days, indicating that demand for homes continues to stay strong.
“Declining buyer activity could be a result of the stiff competition buyers are facing and the end of quarantine restrictions that allow us to focus on family during the summer holidays,” according to Todd Walker, President of Minneapolis Area REALTORS®. “While increasing home prices are usually a good sign for our industry, frequent bids over asking price will naturally cause some buyers to wait out until the market softens and they have a better chance to secure their next home.”
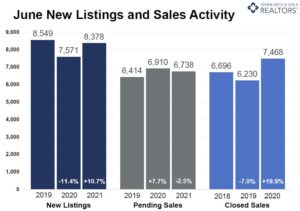
Seller activity grew 10.7 percent last month, resulting in a year-to-date high of 8,378 homes. However, new listings in June were marginally below 2019 performance, down 2.0 percent. As buyer demand out-paced seller supply in the past two years, the Twin Cities continued to be a strong sellers’ market throughout June. The month’s supply of inventory for the metro area remained at 1.0 month, a figure that has not grown significantly all year.
“Although the supply of new listings for June was comparable with pre-COVID performance, there is not enough inventory to meet our current demand,” said Tracy Baglio, President of the Saint Paul Area Association of REALTORS®. “Our Realtors® and their clients are eager for a larger, more diverse, inventory in the housing market. A sustainable balance of buyers and sellers will lead to long-term success in our industry.”
Activity varies by area, price point and property type. Sales of single-family homes were up 47.7 percent in Minneapolis and up 43.3 percent in St. Paul, suggesting demand remains strong in the core cities. Condos continue to lead sales growth by property type. Across the 16-county Twin Cities region condo sales rose 70.5 percent. Sales of previously owned homes rose 23.6 percent while new construction rose 8.2 percent.
May 2021 by the numbers compared to a year ago• Sellers listed 8,378 properties on the market, a 10.7 percent increase from last June
• Buyers signed 6,738 purchase agreements, down 2.5 percent (7,468 closed sales, up 19.9 percent)
• Inventory levels fell 35.5 percent to 6,592 units
• Month’s Supply of Inventory was down 47.6 percent to 1.1 month (4-6 months is balanced)
• The Median Sales Price rose 14.8 percent to $350,000
• Days on Market decreased 52.4 percent to 20 days, on average (median of 7 days, down 61.1 percent)
• Changes in Sales activity varied by market segment
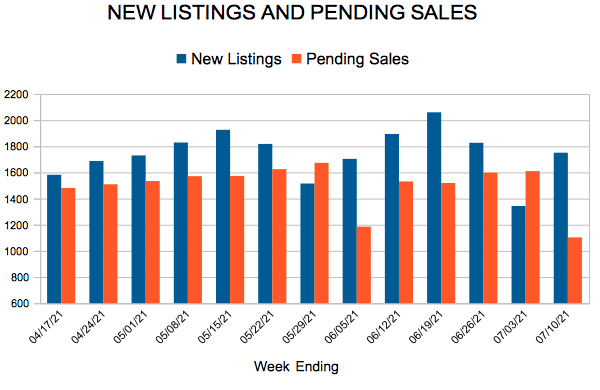
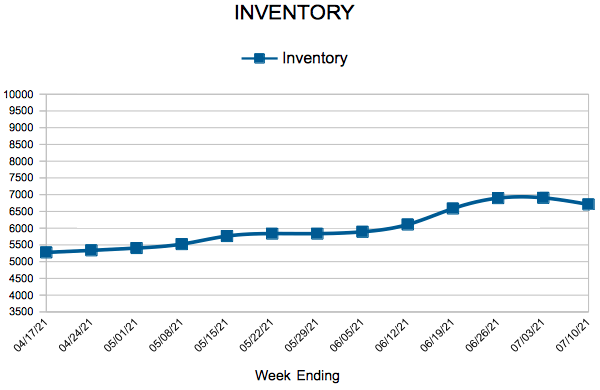
For Week Ending July 10, 2021
As sales prices surge, housing affordability continues to decline, despite historically low interest rates. According to the National Association of REALTORS® Housing Affordability Index, the median family income increased by only 1.2% in May, while the monthly mortgage payment rose to $1,204, a 20% gain compared to a year ago. Homeowners are allocating more of their income toward their mortgage, putting additional strain on consumers’ pocketbooks amid rising inflation, as the Consumer Price Index jumped 5.4% in the year through June, according to the Labor Department, the largest year-over-year gain since August 2008.
In the Twin Cities region, for the week ending July 10:
For the month of June:
All comparisons are to 2020
Click here for the full Weekly Market Activity Report. From MAAR Market Data News.


Licensed In Minnesota
All information deemed reliable but not guaranteed and should be independently verified.