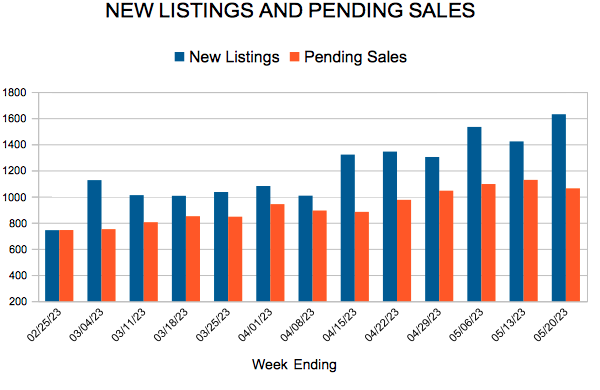
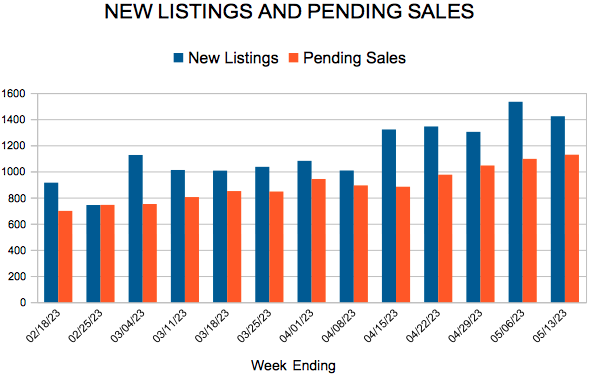
New Listings and Pending Sales
 For Week Ending May 20, 2023
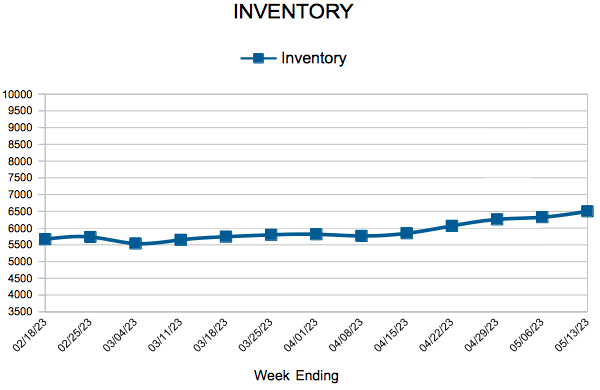
The number of homes available for sale was up 48.3% year-over-year in April, according to Realtor.com’s latest Monthly Housing Market Trends Report, although inventory remains well below pre-pandemic levels. Inventory increased in 42 out of 50 of the largest metros annually, with the typical home spending 41 days on market, up from 26 days the same time last year. Nationally, listing price growth has also softened, rising 2.85% year-over-year, the lowest rate of growth since April 2020.
IN THE TWIN CITIES REGION, FOR THE WEEK ENDING MAY 20:
FOR THE MONTH OF APRIL:
All comparisons are to 2022
Click here for the full Weekly Market Activity Report. From MAAR Market Data News.
May 25, 2023
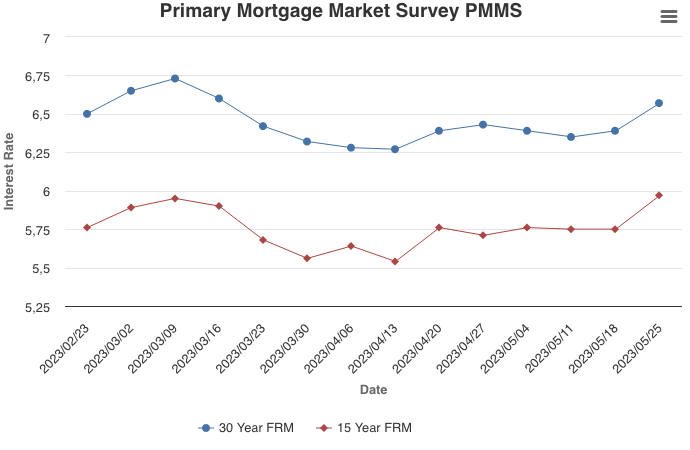
The U.S. economy is showing continued resilience which, combined with debt ceiling concerns, led to higher mortgage rates this week. Dampened affordability remains an issue for interested homebuyers and homeowners seem unwilling to lose their low rate and put their home on the market. If this predicament continues to limit supply, it could open up an opportunity for builders to help address the country’s housing shortage.
Information provided by Freddie Mac.
 For Week Ending May 13, 2023
May is the best month to sell a home, according to a recent analysis by ATTOM Data Solutions, which found that, on average, sellers saw a premium of 12.8% above market value when selling in May. June and April are the second and third best months to sell, with sellers receiving average premiums of 10.7% and 10.3%, respectively. The analysis studied over 51 million home sales between 2011 and 2022 and found that the largest premiums were achieved by sellers who sold in late spring and early summer.
IN THE TWIN CITIES REGION, FOR THE WEEK ENDING MAY 13:
FOR THE MONTH OF APRIL:
All comparisons are to 2022
Click here for the full Weekly Market Activity Report. From MAAR Market Data News.
(May 17, 2023) – According to new data from Minneapolis Area REALTORS® and the Saint Paul Area Association of REALTORS®, home prices dipped slightly from last April. Both buyer and seller activity were also lower compared to last year.
Sales & Prices
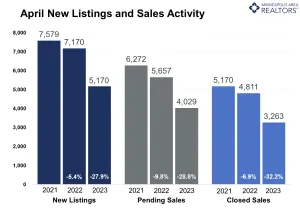
Prices were flat in March and down less than 1.0 percent in April. Despite a slight softening in prices, sellers were still getting offers above their list price, on average (100.1 percent) despite a 28.8 percent decline in sales. These two dynamics seem to portray conflicting pictures. While still present, bidding wars this year haven’t been as extreme as they have over the last couple years. Luxury market activity also cooled slightly more than the rest of the market—though it’s too early to label this a trend. Townhomes tend to sell for about 25.0 percent less than single family homes and made up the largest share of overall closed sales since 2006. This is mostly due to sales in other segments cooling faster than townhomes, but still impacts overall prices.
Home prices are up 28.1 percent since March 2020 but down 0.7 percent from April 2022. “Homeowners sometimes panic when prices soften while buyers often rejoice,” said Jerry Moscowitz, President of Minneapolis Area REALTORS®. “But it’s important to remember that it simply reflects the cross section of homes selling and doesn’t necessarily affect your home’s value. That’s why home buyers should have at least a 5-7 year timeframe.” Sellers are also still getting solid offers in a reasonable timeframe. Some buyers are choosing smaller homes with fewer bedrooms to contain their monthly mortgage payments. At a median of 17 days, homes are still selling as quickly as they did in April 2020. There are just fewer of those sales. But there are also fewer listings. Both supply and demand downshifting together means the balance between buyer and seller activity remains tight as the market remains undersupplied.
Listings and Inventory
In April, sellers brought 5,170 new listings online or 27.9 percent fewer than last year. Inventory levels trickled 4.5 percent lower. Some sellers are choosing to stay put and wait instead of selling for a lower price. Most sellers are also buyers and higher mortgage rates have harmed affordability significantly. “Make no mistake: multiple offers are still happening, and some properties are selling in a few days or less for well over asking,” said Brianne Lawrence, President of the Saint Paul Area Association of REALTORS®. “But this new environment means buyers are being more selective and budget minded.”
The Twin Cities metro is still a seller’s market, just not to the same degree as last year. April’s months supply of inventory was up an even 25.0 percent. That meant we had 1.5 months’ supply of inventory at month-end. Typically 4-6 months of supply are needed to reach a balanced, neutral market.
Location & Property Type
Market activity varies by area, price point and property type. New home sales rose 20.0 percent while existing home sales were down 32.9 percent. Single family sales fell 31.5 percent, condo sales declined 36.1 percent and townhome sales were down 14.4 percent. Sales in Minneapolis decreased 36.4 percent while Saint Paul sales fell 28.6 percent. Cities like North Branch, White Bear Township, Watertown and Mahtomedi saw the largest sales gains while Carver, New Brighton, North St. Paul, Hugo and Lake Elmo all had notably lower demand than last year.
April 2022 Housing Takeaways (compared to a year ago)
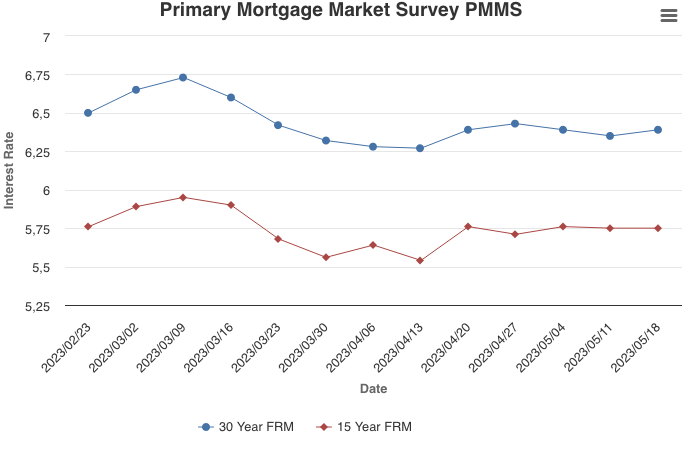
May 18, 2023
The 30-year fixed-rate mortgage averaged 6.39 percent this week, as economic crosscurrents have kept rates within a ten-basis point range over the last several weeks. After the substantial slowdown in growth last fall, home prices stabilized during the winter and began to modestly rise over the last few months. This indicates that while affordability remains a hurdle, homebuyers are getting used to current rates and continue to pursue homeownership.
Information provided by Freddie Mac.

Licensed In Minnesota
All information deemed reliable but not guaranteed and should be independently verified.