Weekly Market Report
 For Week Ending September 21, 2024
Nationally, inventory was up 35.8% year-over-year in August, according to Realtor.com’s latest Monthly Housing Market Trends Report, with active listings now at the highest level since May 2020. As the number of homes for sale continues to grow in many areas, some agents are reporting that list prices are softening, homes are spending more time on market, and price reductions are becoming more common compared to the same period last year.
IN THE TWIN CITIES REGION, FOR THE WEEK ENDING SEPTEMBER 21:
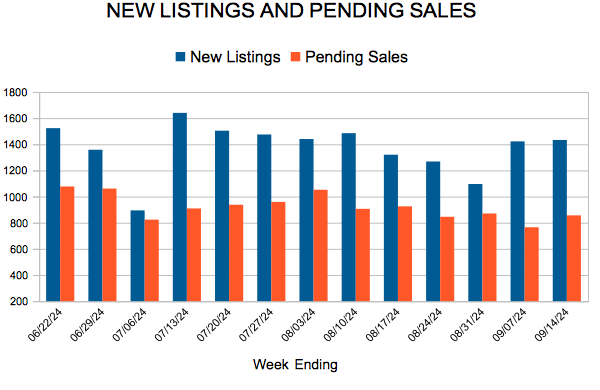
- New Listings increased 11.9% to 1,435
- Pending Sales decreased 1.5% to 879
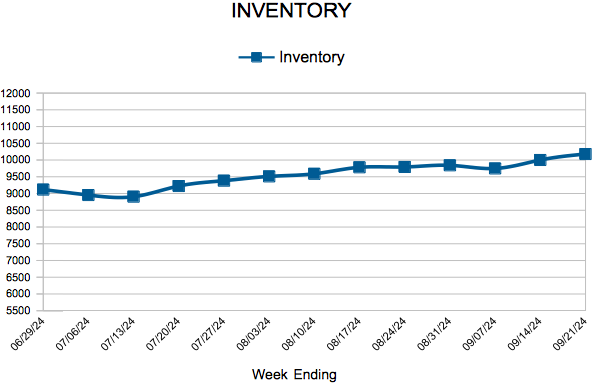
- Inventory increased 11.4% to 10,180
FOR THE MONTH OF AUGUST:
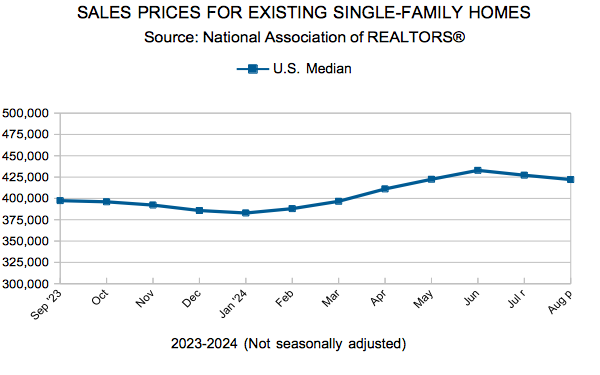
- Median Sales Price increased 2.1% to $388,000
- Days on Market increased 21.2% to 40
- Percent of Original List Price Received decreased 1.3% to 98.7%
- Months Supply of Homes For Sale increased 17.4% to 2.7
All comparisons are to 2023
Click here for the full Weekly Market Activity Report. From MAAR Market Data News.
August Monthly Skinny Video
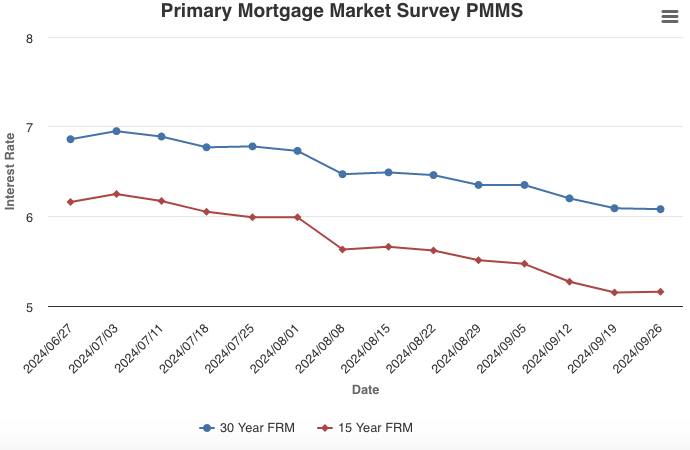
The 30-Year Fixed-Rate Mortgage Reaches Lowest Level in Two Years
September 26, 2024
Although this week’s decline was slight, the 30-year fixed-rate mortgage trended down to its lowest level in two years. Given the downward trajectory of rates, refinance activity continues to pick up, creating opportunities for many homeowners to trim their monthly mortgage payment. Meanwhile, many looking to purchase a home are playing the waiting game to see if rates decrease further as additional economic data is released over the next several weeks.
Information provided by Freddie Mac.
Existing Home Sales
New Listings and Pending Sales
Inventory
Weekly Market Report
 For Week Ending September 14, 2024
Mortgage activity surged the week ending September 13, 2024, as falling interest rates boost borrower demand nationwide. The Mortgage Bankers Association reports mortgage loan application volume increased 14.2% on a seasonally adjusted basis from the previous week, with purchase applications up 5%, while refinance applications jumped 24% from one week earlier.
IN THE TWIN CITIES REGION, FOR THE WEEK ENDING SEPTEMBER 14:
- New Listings decreased 0.6% to 1,433
- Pending Sales decreased 5.1% to 856
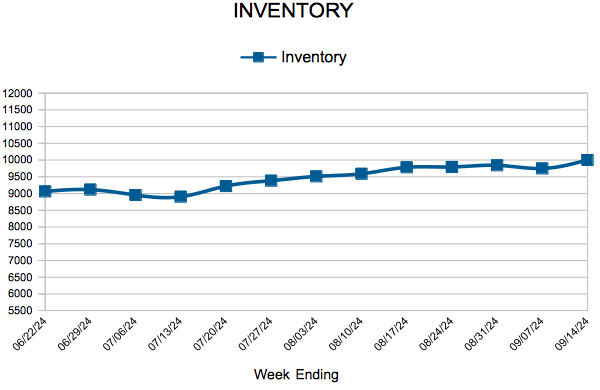
- Inventory increased 11.4% to 10,002
FOR THE MONTH OF AUGUST:
- Median Sales Price increased 2.2% to $388,500
- Days on Market increased 21.2% to 40
- Percent of Original List Price Received decreased 1.3% to 98.7%
- Months Supply of Homes For Sale increased 17.4% to 2.7
All comparisons are to 2023
Click here for the full Weekly Market Activity Report. From MAAR Market Data News.
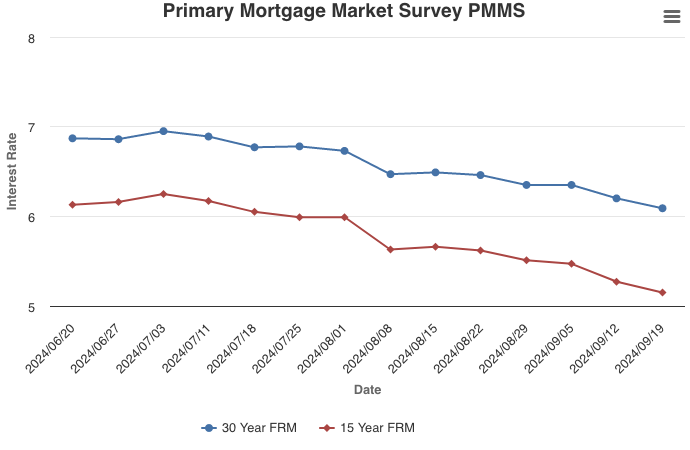
Mortgage Rates Continue to Tumble
September 19, 2024
Mortgage rates continued declining towards the six percent mark, reviving purchase and refinance demand for many consumers. While mortgage rates do not directly follow moves by the Federal Reserve, this first cut in over four years will have an impact on the housing market. Declining mortgage rates over the last several weeks indicate this cut was mostly baked in, but rates will likely fall further, sparking more housing activity.
Information provided by Freddie Mac.
August Housing Market Update
Buyer and seller activity down from last August, but lower rates on the way
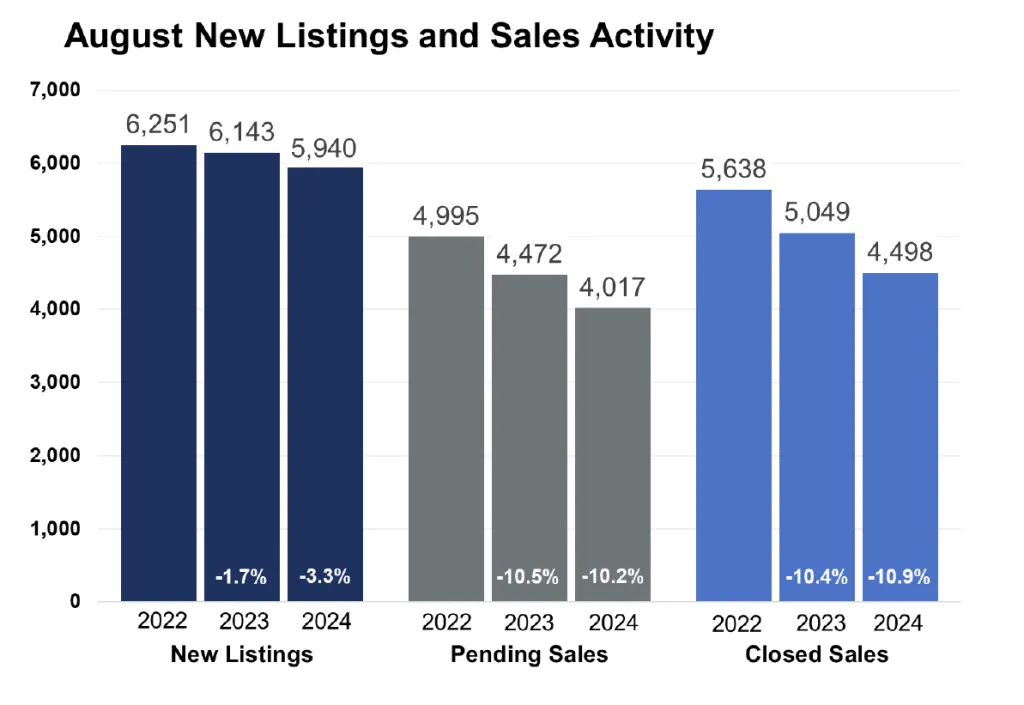
- Pending sales fell 10.2%; new listings down 3.3%
- The median sales price increased 2.6% to $389,700
- Market times rose 21.2% to 40 days; inventory up 11.7% to 9,712
(Sep. 17, 2024) – According to new data from Minneapolis Area REALTORS® and the Saint Paul Area Association of REALTORS®, seller activity softened along with buyer activity. Inventory and prices were higher.
Sellers, Buyers and Housing Supply
$2,820. That’s what a homeowner would save per year if they purchased or refinanced the median-priced home in August compared to if they purchased it when rates were at their peak in late 2023. Assuming 20.0% down, the monthly payment on a $389,700 home decreased from $2,790 to $2,555 per month when comparing August interest rates to when they were at their peak. At today’s mid-September rate of 6.1%, that payment drops even further to $2,474. That includes principal, interest, taxes and insurance. It’s a good representation of real monthly costs outside of maintenance and repairs. And that $2,820 in annual savings amounts to about 2.3% of the median family income in the metro.
Those lower rates need some time to course through the system before impacting demand. For August, pending sales were down 10.2% but are only down 0.7% for the year. Seller activity was also lower; new listings fell 3.3% but are actually up 8.5% for the year. Homes took more time to sell. At an average of 40 days, market times were up 21.2% for the month but are only 7.3% higher compared to 2023 year-to-date. Buyers thirsty for more inventory will benefit from an 11.7% increase in the number of homes for sale. That figure has now risen for ten straight months. Unfortunately, that inventory isn’t necessarily at the price points or in the locations today’s home buyers want or need.
Prognosticators are already discussing Spring market 2025. The rate environment should continue to improve, but a significant backlog of pent-up demand could overwhelm even the inventory growth we’ve seen. Unleashing that demand could also mean buyers once again find themselves in multiple-offer situations writing contracts for over list price. “The biggest hurdle is affordability; the other big hurdle has been supply,” said Jamar Hardy, President of Minneapolis Area REALTORS®. “The trend in mortgage rates is promising, but it will take time to fix our long-term housing shortage.”
Prices, Market Times and Negotiations
Prices are still rising but at a more subdued pace. The market-wide median sales price rose to $389,700, but the existing single-family median price is $410,000 and new single-family homes fetched $535,000. Overall, sellers accepted offers at 98.7% of their list price on average. Single-family sellers got 99.0% while condos were closer to 96.0%. Despite a metro-wide average of 40 days, single-family homes spent 37 days on market while condos spent 74. ““There’s more variation across different areas and price points than most would expect,” said Amy Peterson, President of the Saint Paul Area Association of REALTORS®. “Lower interest rates could result in quicker market times and stronger offers, so a drop in rates could cancel out any inventory gains.”
Location & Property Type
Market activity always varies by location and segment. Despite the new home market being better supplied, new home sales underperformed existing home sales. And despite better affordability, condo sales fell nearly twice as much as single family. Sales over $500,000 performed better than sales under $500,000 as higher-end buyers are less rate-sensitive. Cities such as Centerville, Dellwood, St. Bonifacius and Minnetrista had among the largest sales gains while Stacy, Ham Lake and Elko New Market all had notably weaker demand. For cities with at least three sales, the highest priced areas were Afton, Woodland, Excelsior, Wayzata and Orono while the most affordable areas were Rush City, Elko New Market, Osseo and Oakdale.
August 2024 Housing Takeaways (compared to a year ago)
- Sellers listed 5,940 properties on the market, a 3.3% decrease from last August
- Buyers signed 4,017 purchase agreements, down 10.2% (4,498 closed sales, up 13.8%)
- Inventory levels increased 11.7% to 9,712 units
- Month’s Supply of Inventory rose 13.0% to 2.6 months (4-6 months is balanced)
- The Median Sales Price was up 2.6% to $389,700
- Days on Market rose 21.2% to 40 days, on average (median of 20 days, up 33.3%)
- Changes in Pending Sales activity varied by market segment and price point
- Single family sales fell 7.9%; condo sales were down 14.0%; townhouse sales decreased 16.3%
- Traditional sales were down 9.7%; foreclosure sales declined 23.4% to 36; short sales rose 28.6% to 9
- Previously owned sales decreased 8.8%; new construction sales were down 16.6%
- Sales under $500,000 declined 11.4%; sales over $500,000 fell 4.0%
- « Previous Page
- 1
- …
- 24
- 25
- 26
- 27
- 28
- …
- 104
- Next Page »

