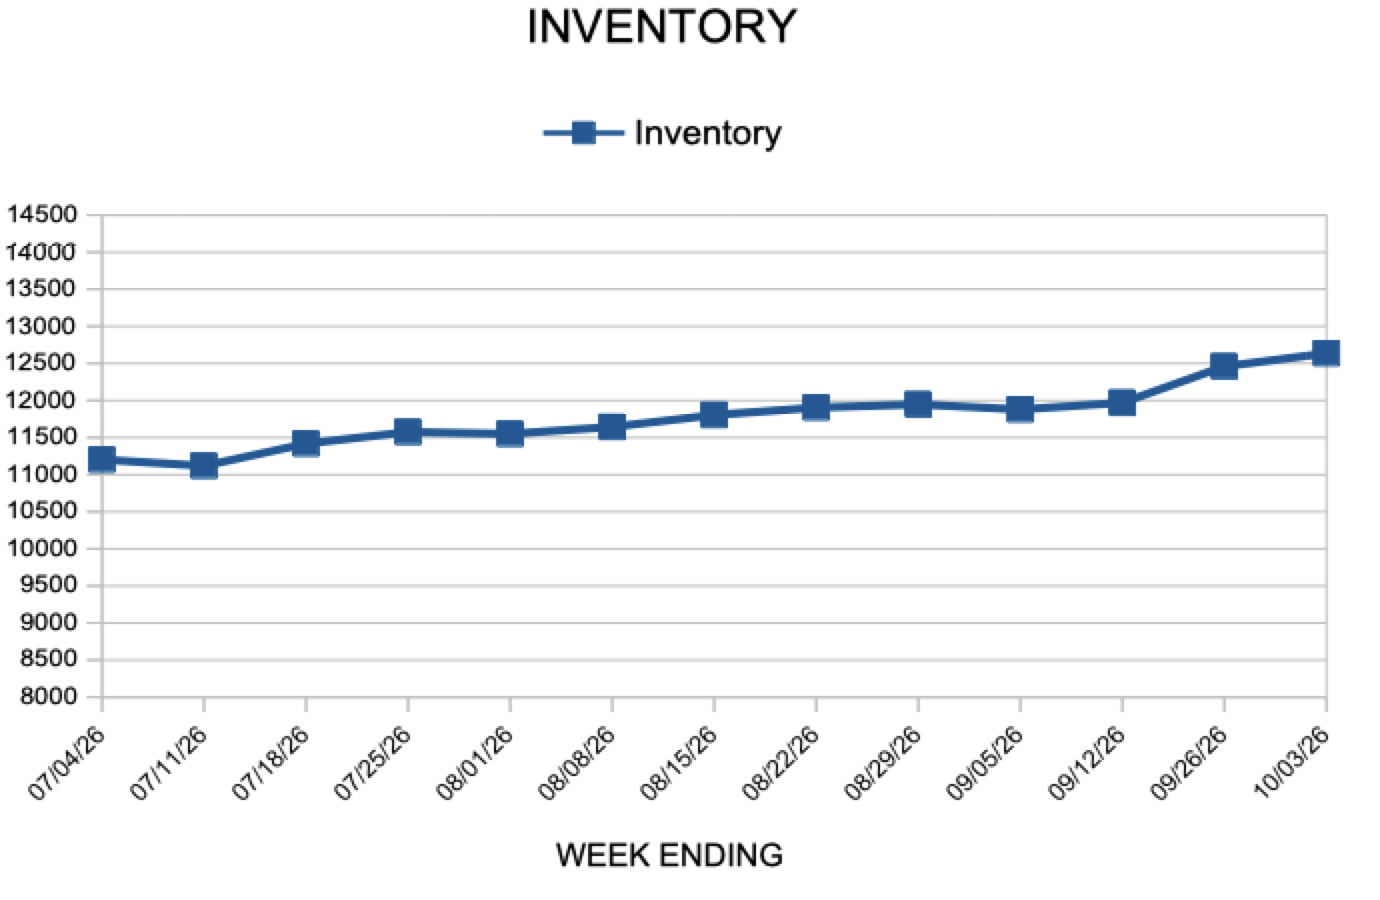
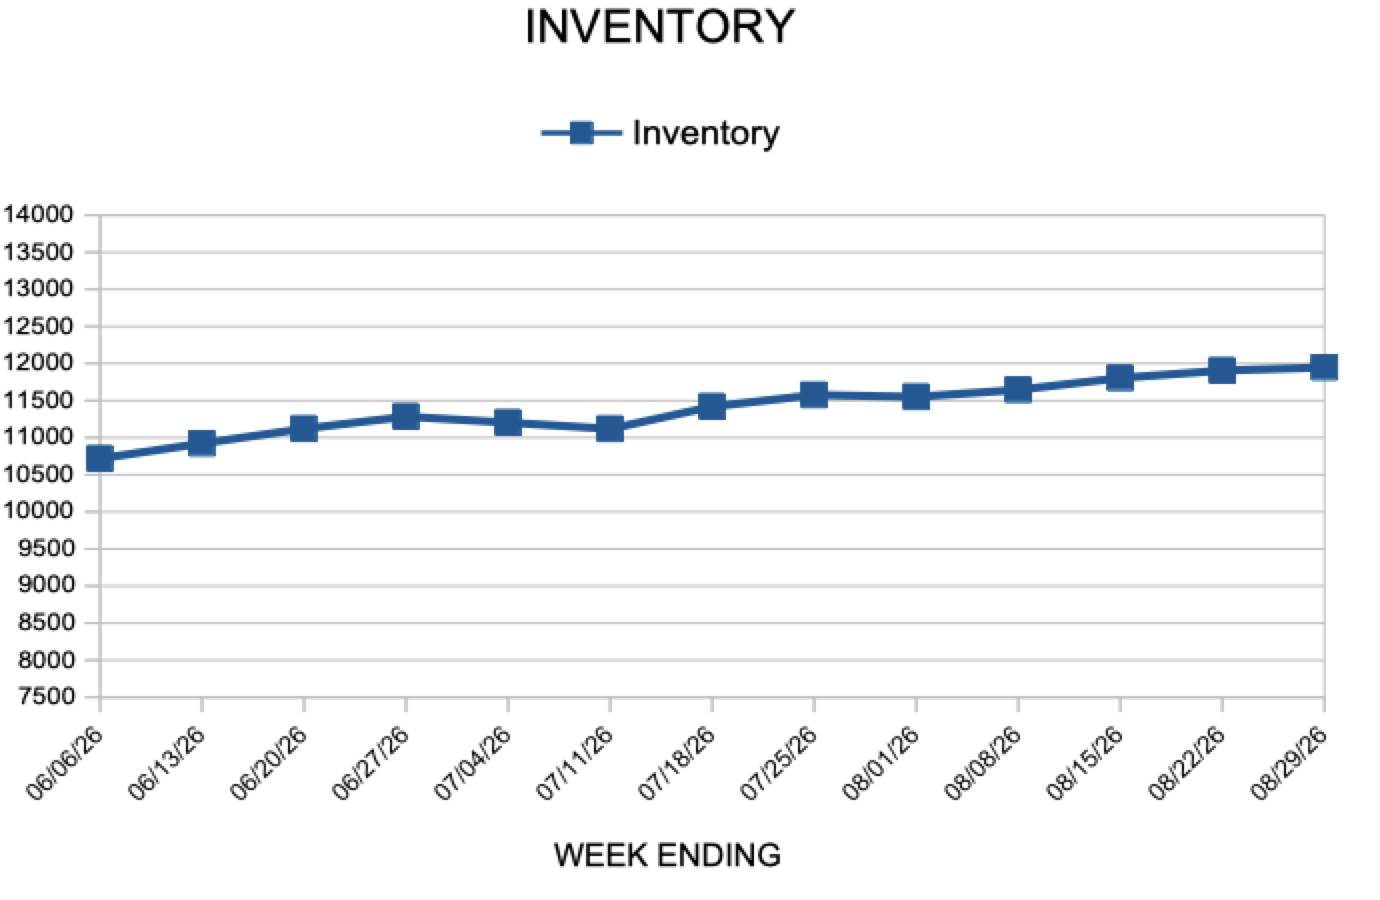
Inventory

Newly pending sales fell 8.5% from a year earlier in September and 11.2% from August, according to Zillow’s September Market Report. Zillow’s count of closed sales was 319,346, down 2.5% from a year earlier and 5.6% from August. The typical U.S. home value was $366,913, up 1% from a year ago, while a typical mortgage payment of $1,922 was 6.7% higher than last year, assuming a 20% down payment and excluding taxes and insurance. With 1.39 million homes for sale, 2.5% more than a year ago, and price cuts on 27.4% of listings, buyers still in the market have more room to negotiate.
In the Twin Cities region, for the week ending October 3:
For the month of August:
All comparisons are to 2025
Click here for the full Weekly Market Activity Report. From MAAR Market Data News.
The 30-year fixed-rate mortgage averaged 7.28% as of October 1, up from 7.03% a week earlier and 6.34% a year ago, according to Freddie Mac. The 15-year fixed rate mortgage averaged 6.60%, up from 6.42% the prior week. For active buyers, an updated payment estimate can show how the latest rate change affects their monthly principal-and-interest payment.
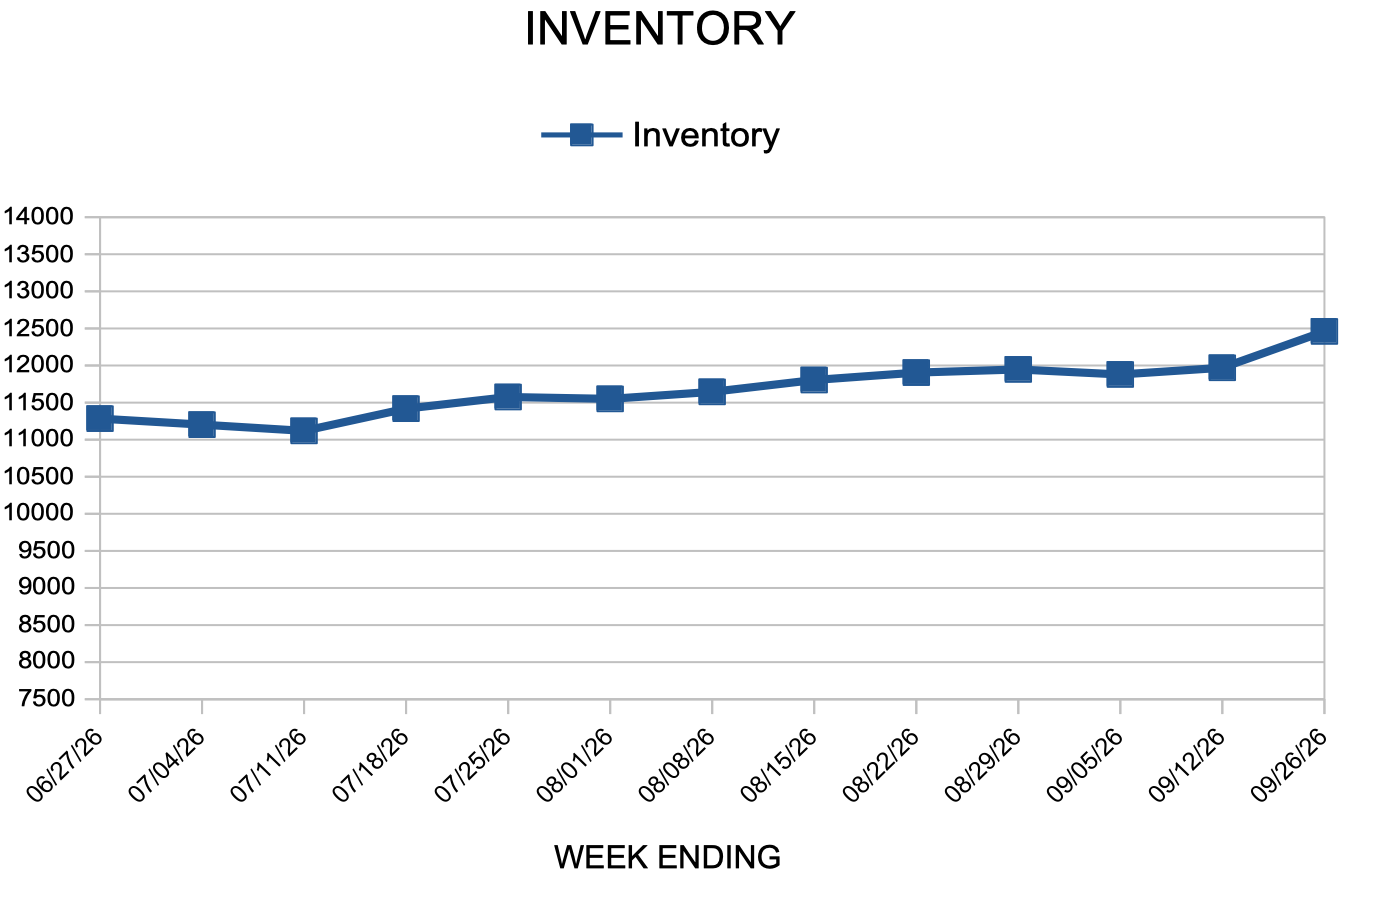
In the Twin Cities region, for the week ending September 26:
For the month of August:
All comparisons are to 2025
Click here for the full Weekly Market Activity Report. From MAAR Market Data News.
Buyers shopping this fall will find more options and less competition. Active inventory rose 3% year over year in August to 1.41 million homes — the widest selection since mid-2020 — while more than one in four listings saw a price reduction, according to Zillow’s August Market Report. Meanwhile, the Federal Reserve raised its benchmark rate this week for the first time in more than three years, and mortgage rates climbed to 6.95%, up from 6.66% just three weeks ago, according to Freddie Mac. For clients actively searching, now is a good time to discuss rate-lock options with their lender.
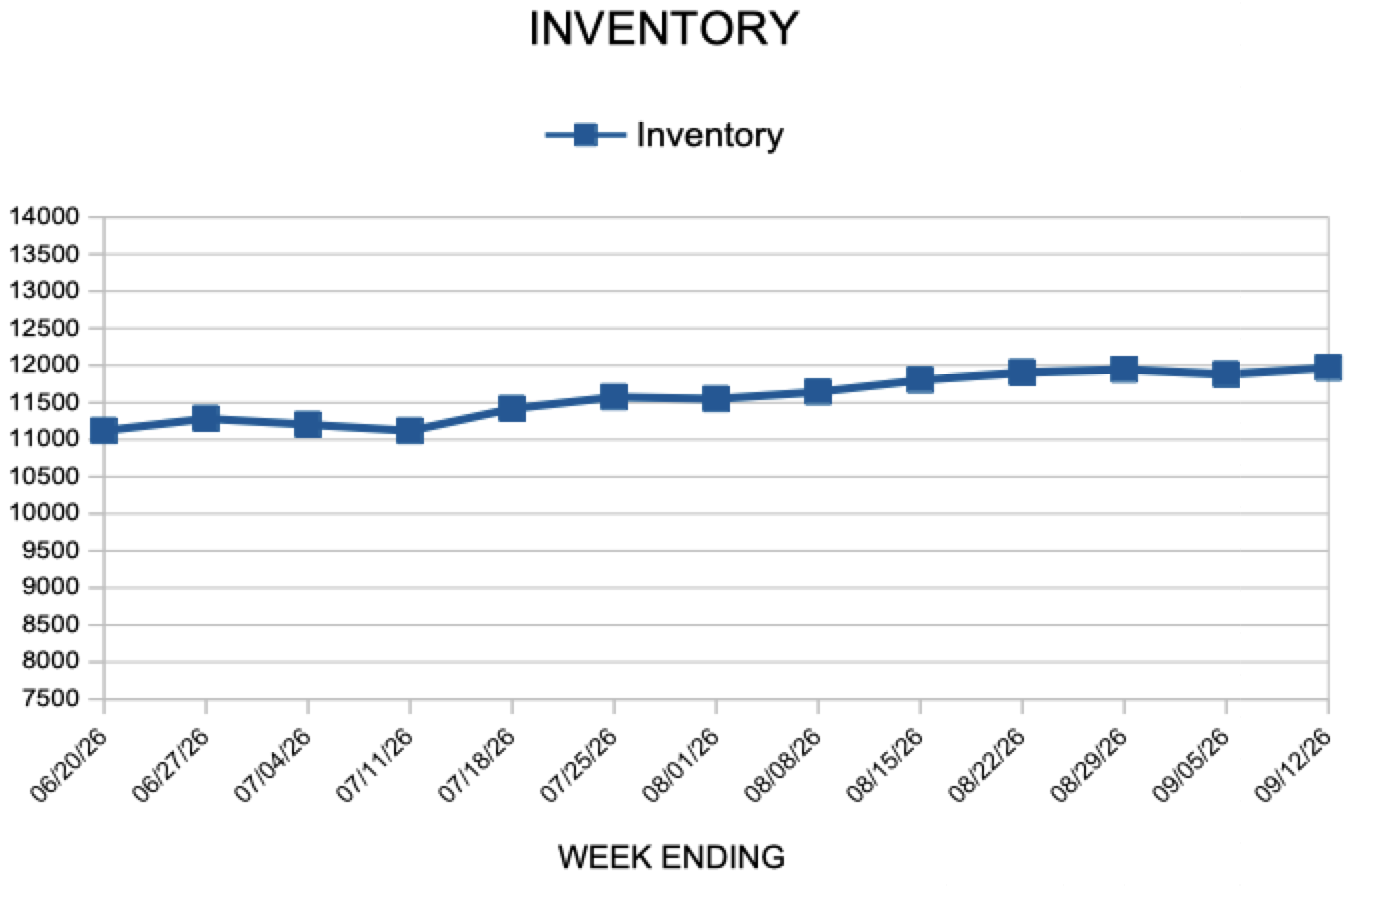
In the Twin Cities region, for the week ending September 12:
For the month of August:
All comparisons are to 2025
Click here for the full Weekly Market Activity Report. From MAAR Market Data News.
The economy added 162,000 jobs in August, more than three times what forecasters expected, according to the Bureau of Labor Statistics. The strong report, combined with upward revisions to prior months, suggests the job market remains resilient despite higher borrowing costs. Residential construction added 7,300 positions as builders continue to address housing supply. For buyers weighing their options, the robust employment picture signals stability — but it also raises the odds that the Federal Reserve may raise rates at its September meeting, making now a potentially opportune time to lock in financing.
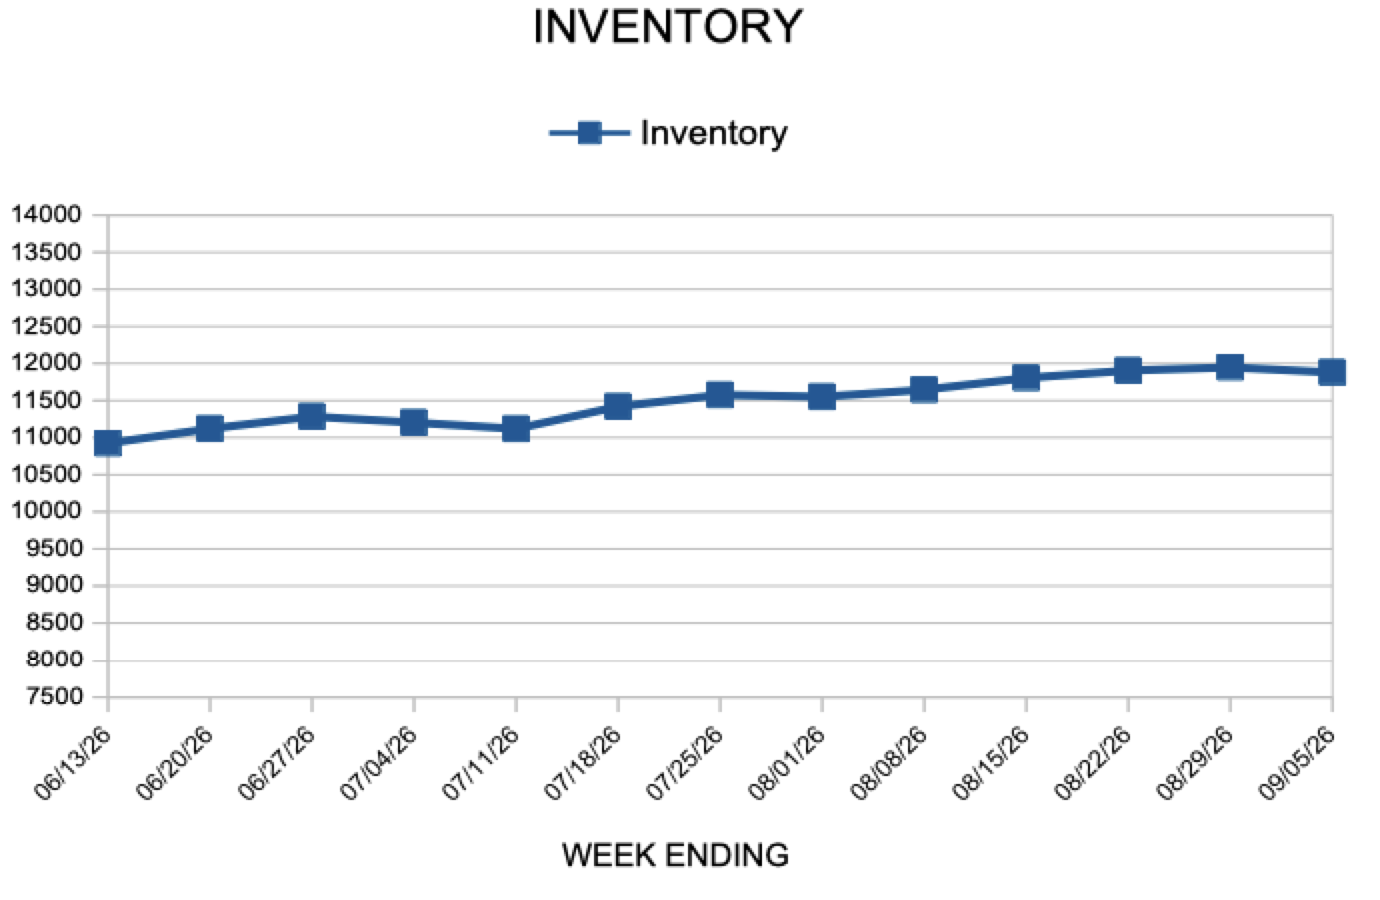
In the Twin Cities region, for the week ending September 5:
For the month of July:
All comparisons are to 2025
Click here for the full Weekly Market Activity Report. From MAAR Market Data News.
Mortgage rates edged higher this week, with the 30-year fixed-rate mortgage averaging 6.71% as of September 3, according to Freddie Mac. This is up from 6.66% the prior week and 6.50% a year ago. Purchase demand has remained relatively stable, indicating steady interest from buyers adapting to evolving market conditions despite rates hovering near multi-year highs.
In the Twin Cities region, for the week ending August 29:
For the month of July:
All comparisons are to 2025
Click here for the full Weekly Market Activity Report. From MAAR Market Data News.

Licensed In Minnesota
All information deemed reliable but not guaranteed and should be independently verified.